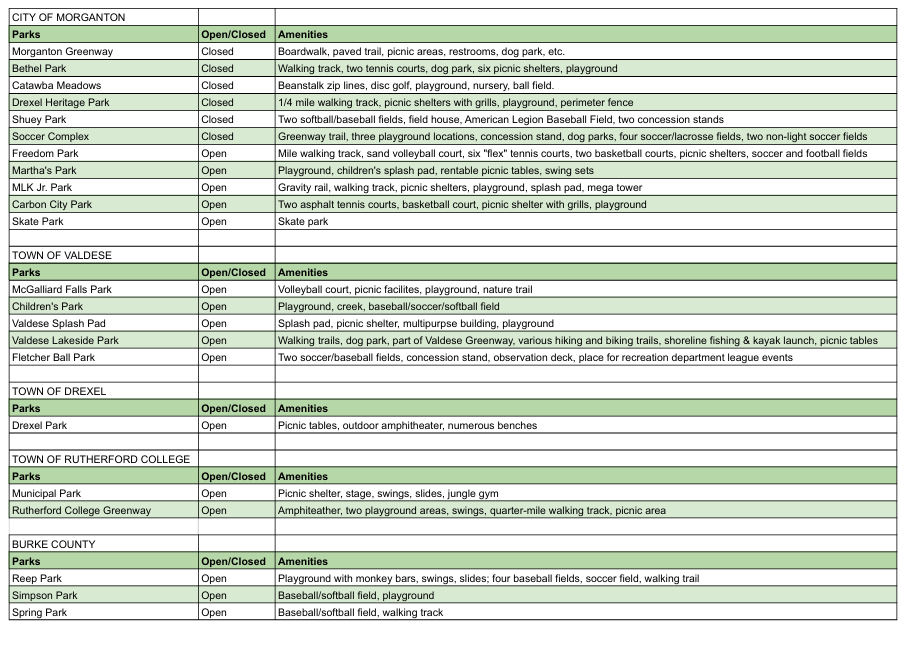
With public input in hand, the Valdese Parks and Recreation department is one step closer to developing a 10-Year Comprehensive Plan.
In August and September 2024, surveys were conducted to see what respondents had to say about their recreational amenities and facilities.
Those surveys were followed by two recent public input forums, where attendees read over the survey results and provide feedback. Information from the survey and the forums will be incorporated into the plan.
The plan is being developed by the Western Piedmont Council of Governments (WPCOG), which had representatives at the forums to answer questions. The plan will provide goals and recommendations, a needs assessment of facilities, trends and projections, and other additional information.
Duncan Cavanaugh, WPCOG’s Center for Research and Data Analytics manager, said the council will review the results and provide suggestions on the plan. WCPOG will work with Parks and Recreation Director David Andersen and staff to review the drafted plan.
The contracted completion date is set for June 30.
The following is some of the information from the conducted survey. In the parentheses are the number of respondents.
OVERVIEW OF RESPONDENTS
Of the 321 responses, about 66% of respondents are Valdese residents while 34% are not. Around 60% pay Valdese property taxes while 40% do not. Of those who live in Valdese, 182 respondents pay town taxes while 26 people do not.
In response to how many people are in the household, the highest ranked age groups were age 60+ (191), age 40-49 (162), and age 30-39 (153).
The greatest number of responded said their household included children 18 and under (168), followed by only adults 22 or older (137), and two children 18 and under (81).
There were 267 White individuals, 37 preferred not to say, four American Indian/Alaska Native, two Black individuals, and one Hispanic/Latino.
Around 17% of respondents said their annual household income was below $49,999. The other percentages included:
- 32%: $50K to $99,999
- 32%: Above $100,000
- Around 20% chose not to answer
ACTIVITIES
Overall, the average rating for Valdese parks and recreation facilities was 4 out of 5.
Ranking recreation activities 1-5, these three categories were at ranked as the highest priority:
- Paved walking, jogging, running, biking trails, such as greenways (84)
- Indoor swimming pools (72)
- Outdoor swimming pools (57)
The top five recreational activities were walking/jogging/running (243); swimming (187); hiking (159); playground activities (123); and weightlifting/fitness classes (107).
The top five classes were water exercise (60); land exercise (55); youth basketball (55); tackle football (53); and swimming lessons (49). Other programs listed were yoga, leagues for older kids, adult sports, and adaptive activities for special needs/disabled individuals.
Around 51% of respondents believe that additional staff is needed while around 40% believe there is adequate staff. Only 1% believe staff should be reduced. Written responses noted that they value the staff at the facilities, but know they are underpaid and understaffed.
When asked whether the Town of Valdese provides enough about recreation programs, 63% said yes while 37% disagreed.
VALDESE COMMUNITY/AQUATIC CENTER
When asked how many times they have used the center in the past year, 41.07% answered more than 15 times.
The center was ranked “good” by 51.25%, followed by 23.75% saying it was “excellent.”
The top improvement requests were:
- Improve pool (121)
- Provide additional seating and lounging around the pool (110)
- Additional parking (86)
McGALLIARD FALLS PARKOf most respondents, 42.32% said they visited the park one to five times that year. Following that is 17.87% who visited five to 10 times.
The park was ranked “good” by 52.2%, followed by 20.31% saying it was “fair.”
Improvement suggestions were:
- Improve public restrooms (148)
- Increase beautification (101)
- Improve falls viewing area (89)
VALDESE LAKESIDE PARK
In the past year, 30.72% have visited the park over 15 times. However, 27.90% said they have visited only one to five times.
The lakeside park was ranked as “excellent” by 46.37%, followed by 36.28% saying it was “good.”
Improvement suggestions included:
- Improve picnic area by adding shelter or grilling/sitting areas (68)
- Add new fishing areas (64)
- Add nature/lake observation areas (61)
CHILDREN’S PARK
As a top response, 40.25% had not visited the Children’s Park in the past year while 27.04% visited one to five times.
Around 31.87% said the park was “good” while 28.44% said it was “fair.”
Improvement suggestions listed were:
- Improve public restrooms (144)
- Improve playground equipment (93)
- Have/do not use park (87)
FLETCHER BALLPARK
In the past year, 64.33% did not visit the ballpark with 14.01% visiting over 15 times.
Around 55.63% either did not know how to rank the park or had not visited the park. A 17.19% said the park was “fair.”
Improvements suggestions were:
- Have/do not use park (154)
- Improve bathrooms (86)
- Improve scoreboards (71)
TIGER GYM
Regarding facility use, 64.42% had not visited the gym.
Ranking the gym, 53.46% either did not know how to rank the gym or had not visited the gym. Slightly more than 16% said the gym was “fair.”
Improvement suggestions listed were:
- Have/do not use park (146)
- Improve bathrooms (60)
- Improve seating areas at the football field (56)